Essential Math for Data Science: Visual Introduction to Singular Value Decomposition (SVD)
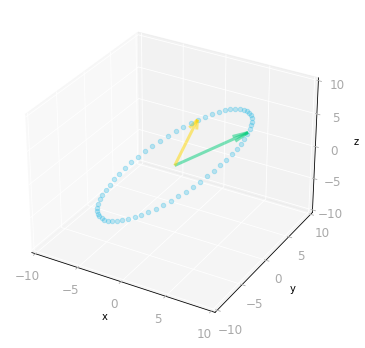 Transformation of the unit circle and basis vectors.
 ⥈ ⥈ ⥈Essential Math for Data Science: Eigenvectors and application to PCA
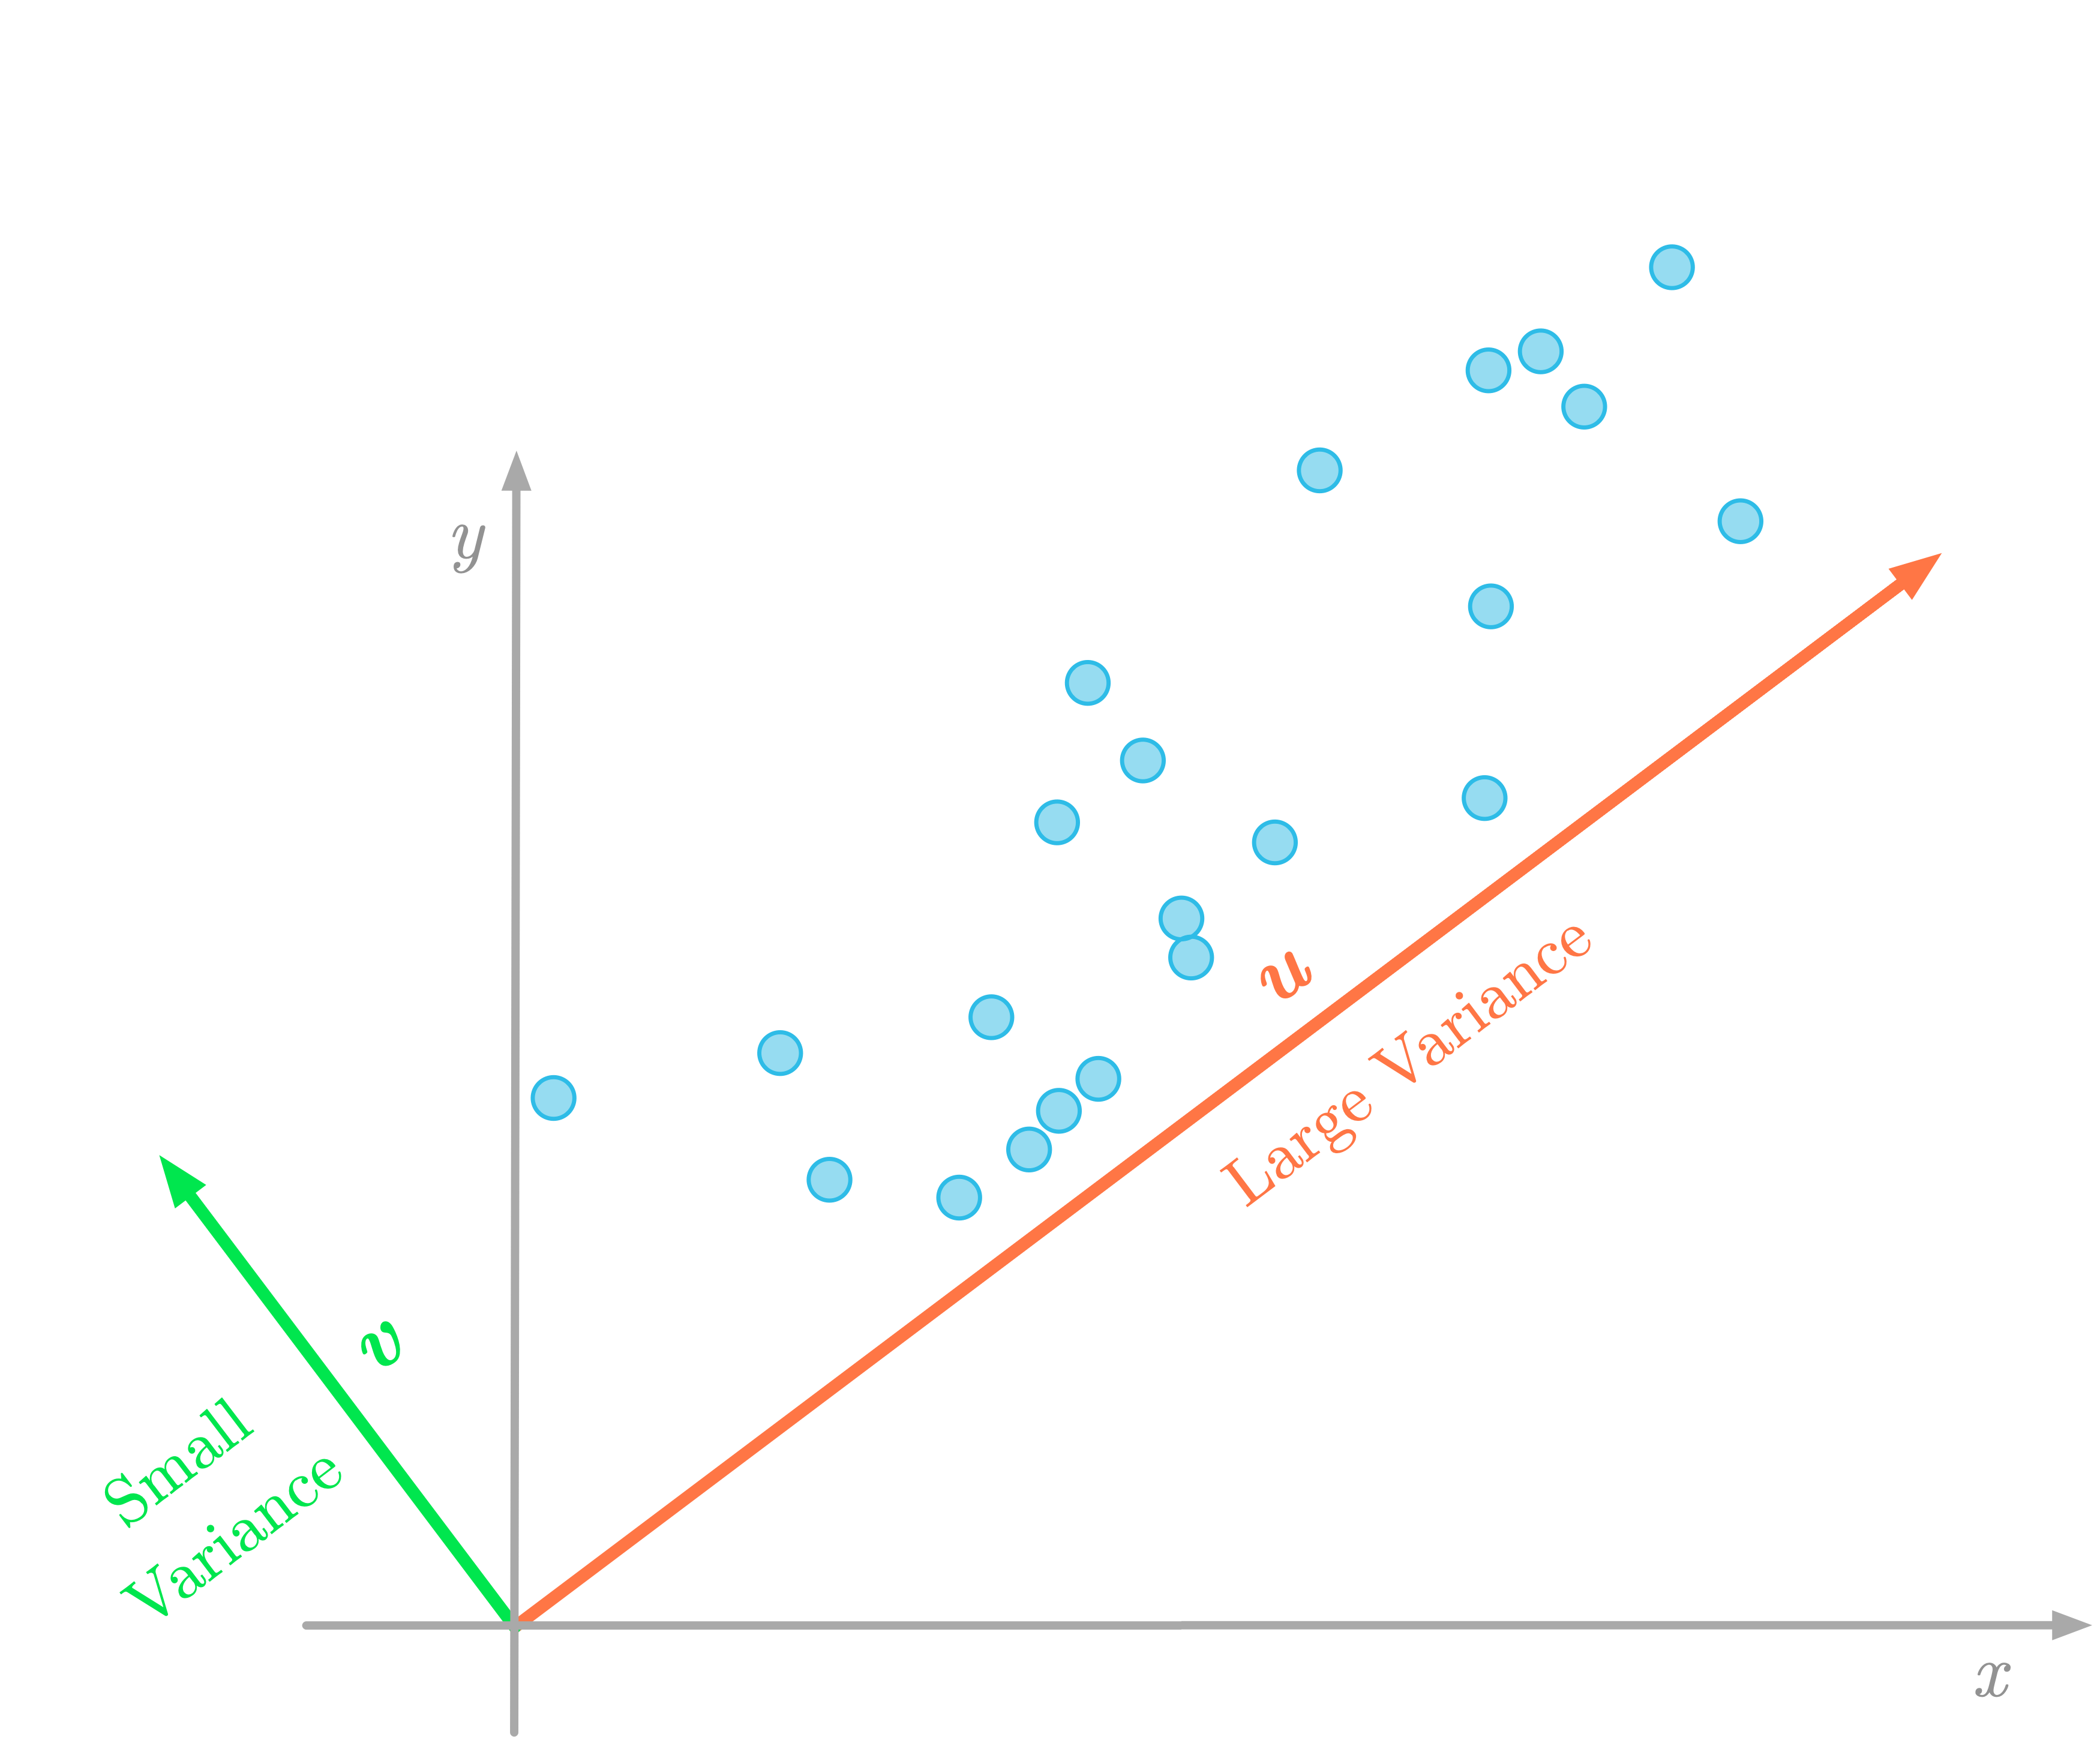 The variance of the data in the direction of the vector $\vu$ (red) is larger than in the direction of the vector $\vv$ (green).
 ⥈ ⥈ ⥈Essential Math for Data Science: Basis and Change of Basis
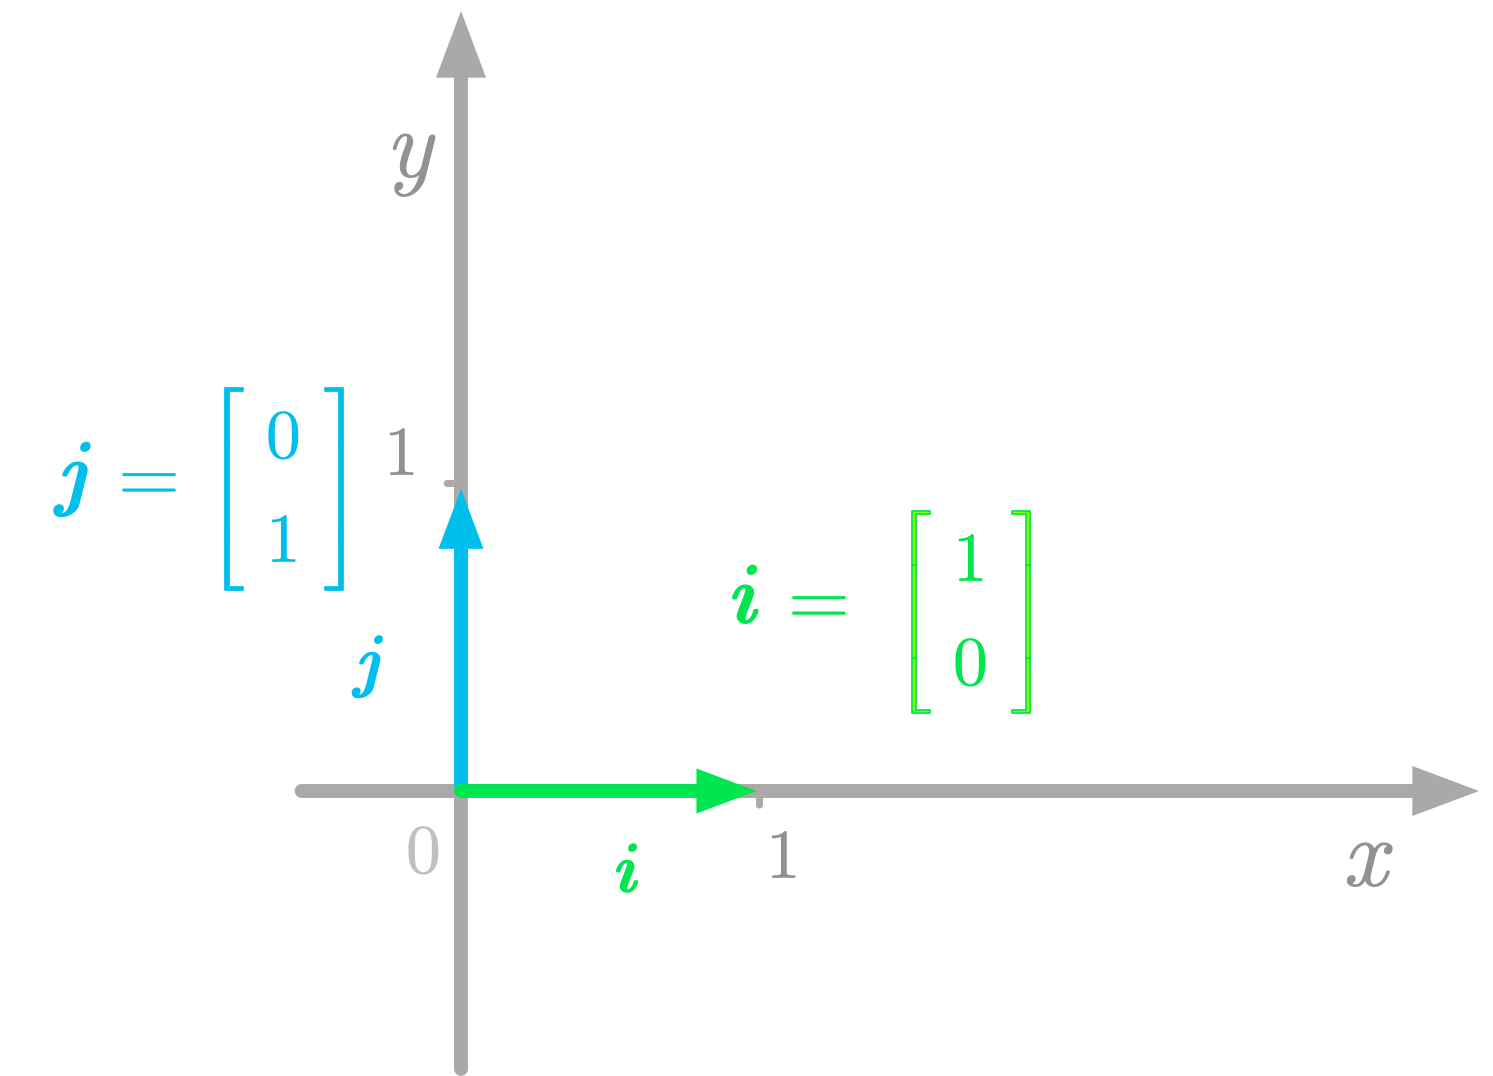 The basis vectors in the Cartesian plane.
 ⥈ ⥈ ⥈Essential Math for Data Science: Introduction to Systems of Linear Equations
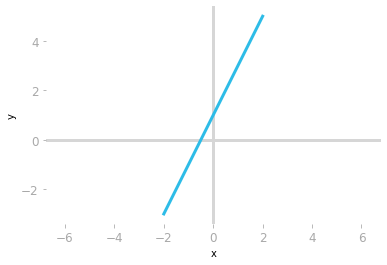 Plot of the equation $y=2x+1$.
 ⥈ ⥈ ⥈Essential Math for Data Science: Linear Transformation with Matrices
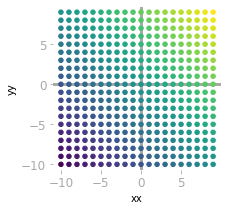 Each point corresponds to the combination of x and y values.
 ⥈ ⥈ ⥈Essential Math for Data Science - Introduction to Matrices and the Matrix Product
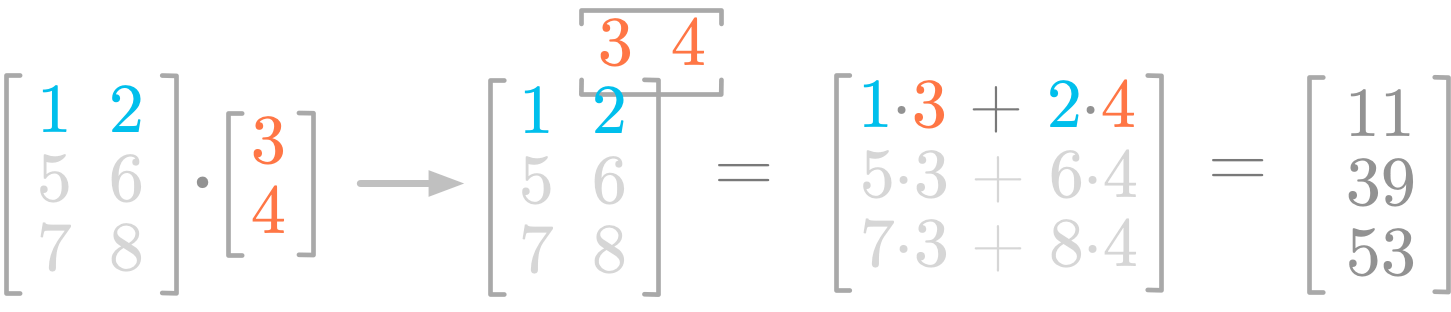 Steps of the product between a matrix and a vector.
 ⥈ ⥈ ⥈Essential Math for Data Science: Scalars and Vectors
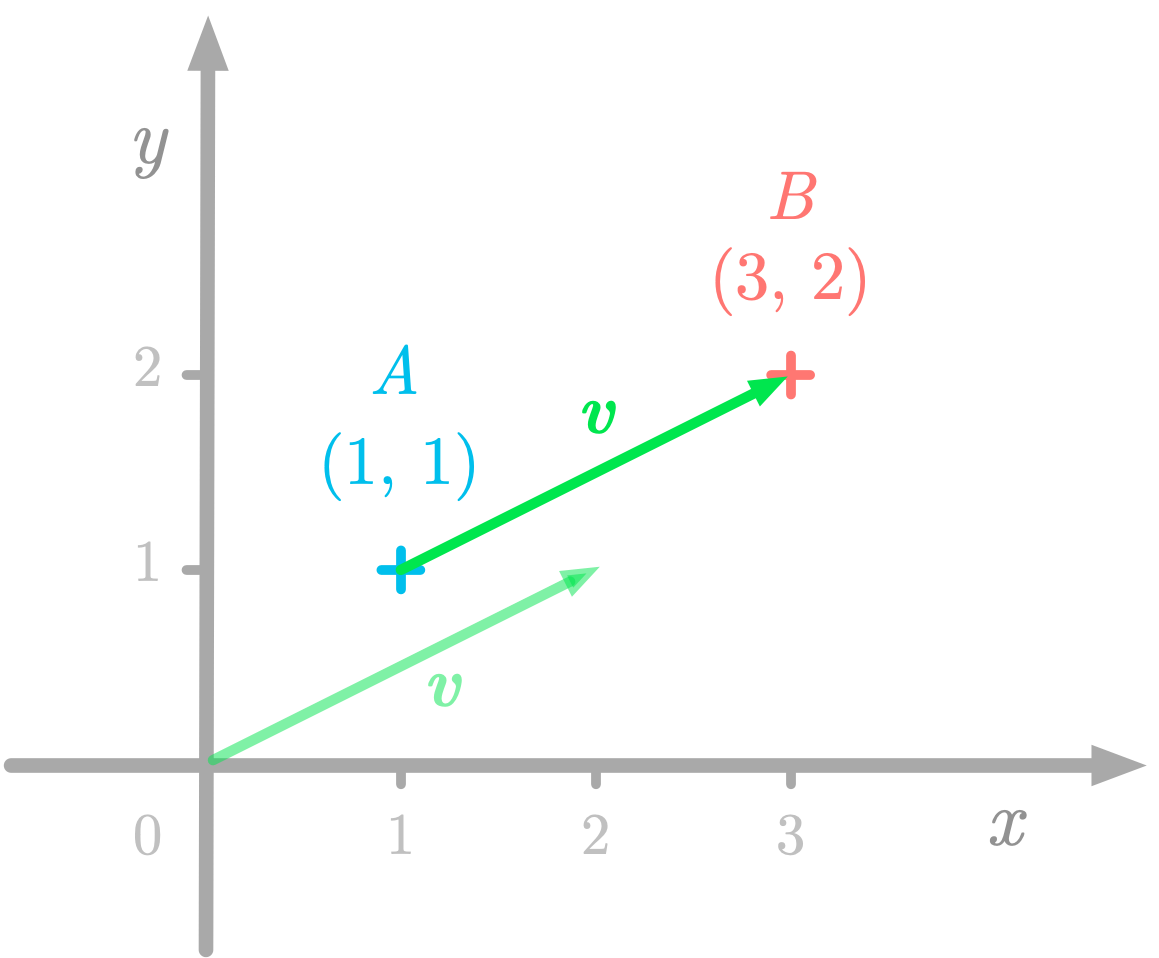 A geometric vector running from $A$ to $B$.
 ⥈ ⥈ ⥈Essential Math for Data Science: Information Theory
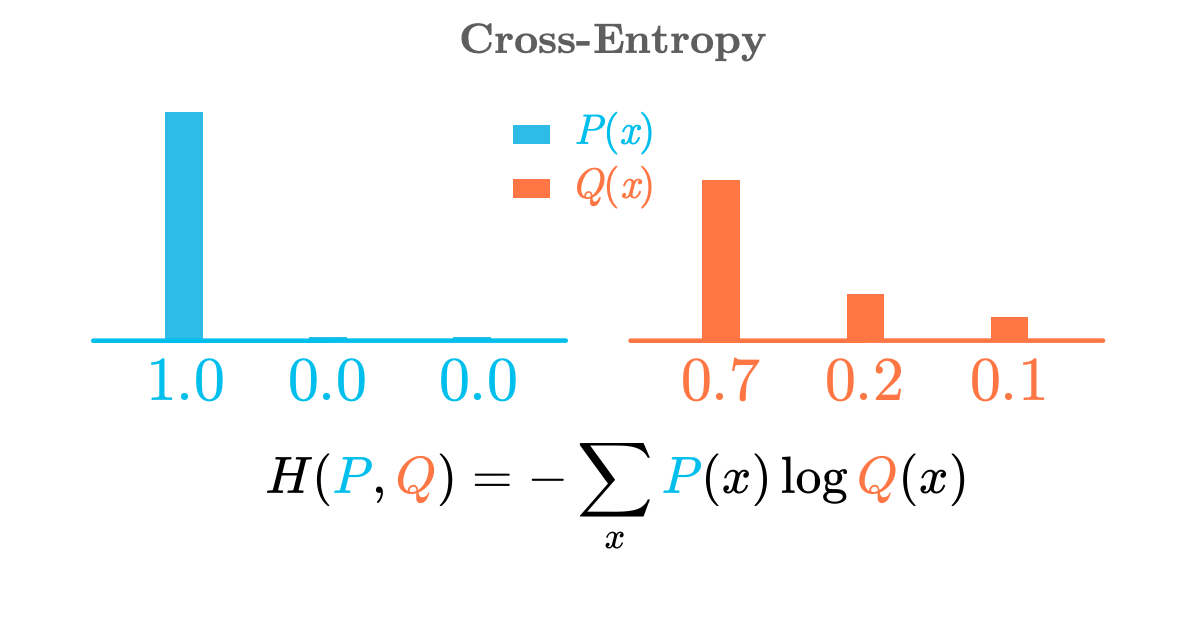 The cross-entropy as a measure of difference between two distributions
 ⥈ ⥈ ⥈Essential Math for Data Science: The Poisson Distribution
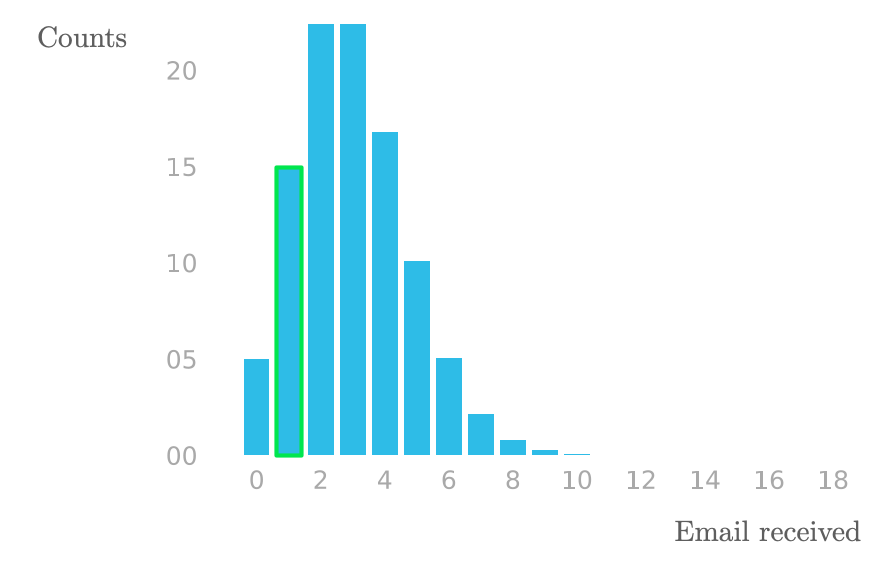 Emails received by Sarah in one-hour intervals for the last 100 hours.
 ⥈ ⥈ ⥈Essential Math for Data Science: Probability Density and Probability Mass Functions
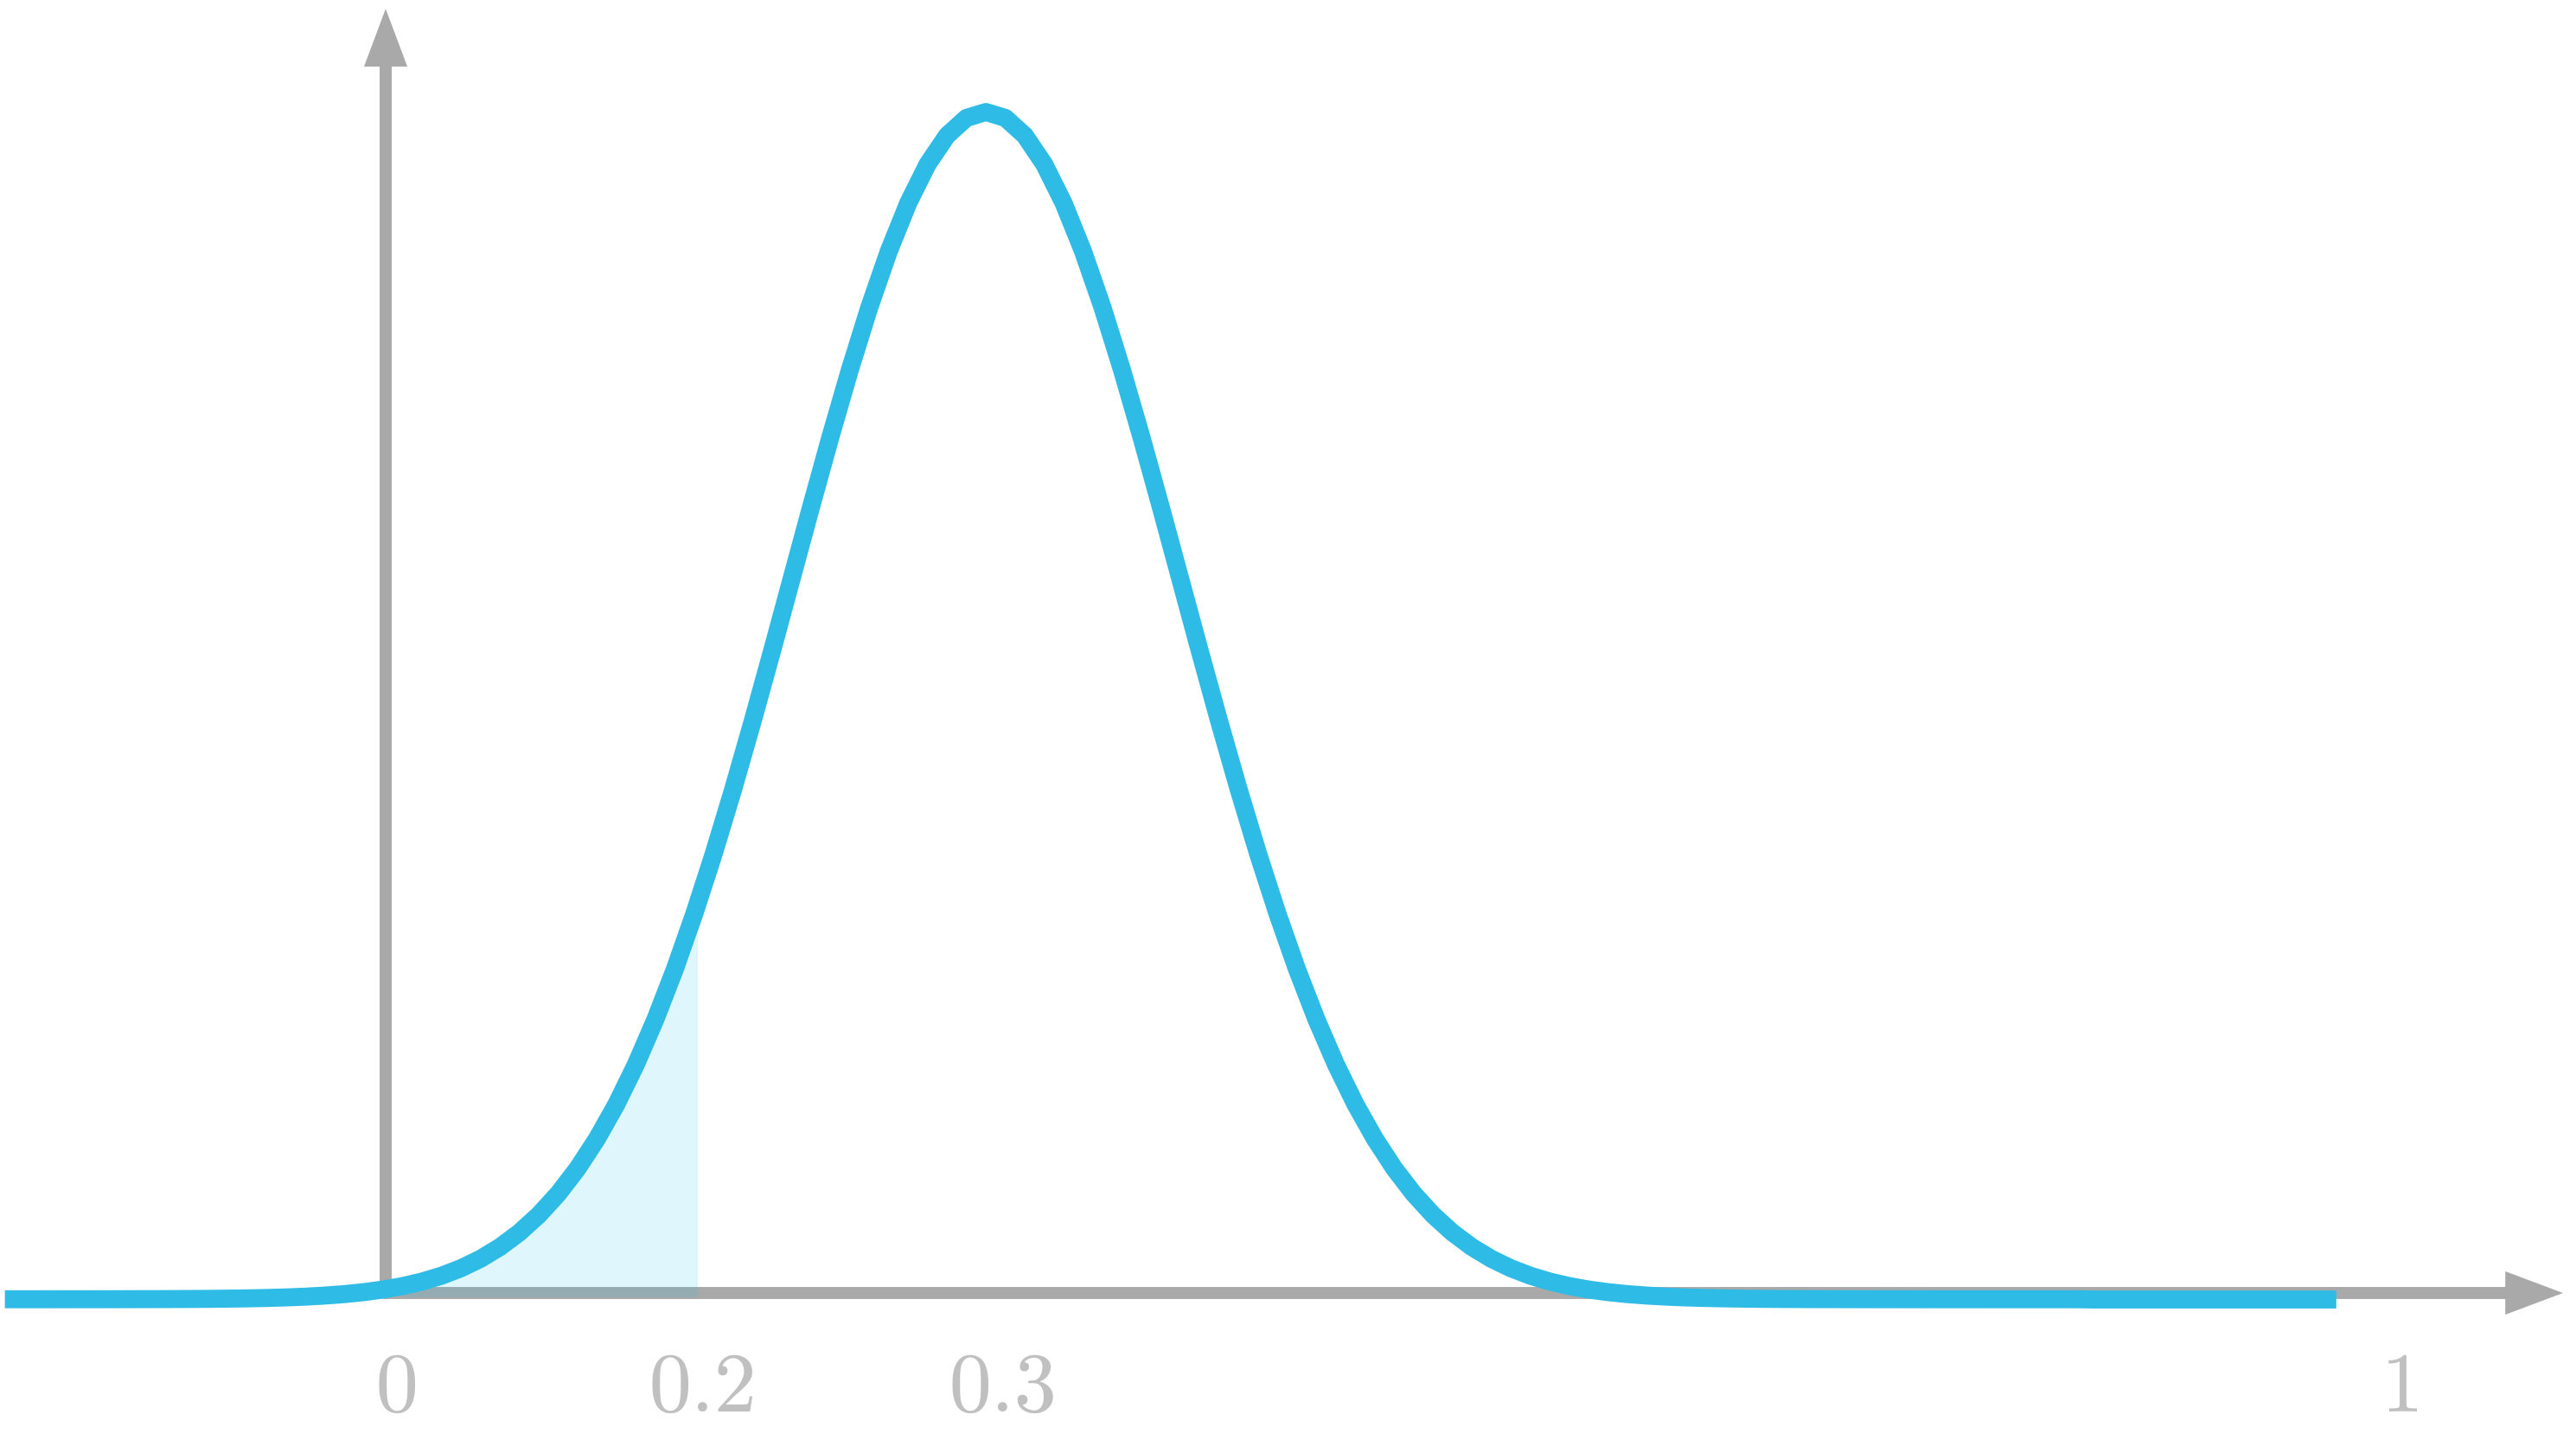 The probability to draw a number between 0 and 0.2 is the highlighted area under the curve.
 ⥈ ⥈ ⥈Essential Math for Data Science: Integrals And Area Under The Curve
 Area under the curve.
 ⥈ ⥈ ⥈Essential Math for Data Science: New Chapters
 L1 Regularization
 ⥈ ⥈ ⥈Essential Math for Data Science
 SVD Geometry
 ⥈ ⥈ ⥈Deep Learning Book Series 3.4 and 3.5 Marginal and Conditional Probability
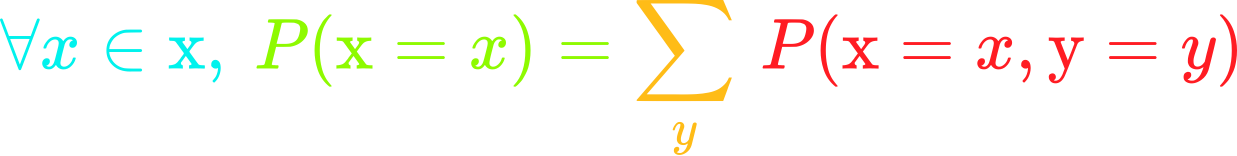 The sum rule allows to calculate marginal probability from joint probability.
 ⥈ ⥈ ⥈Deep Learning Book Series 3.1 to 3.3 Probability Mass and Density Functions
 and area under the curve") Probability density function and area under the curve between 0.5 and 0.7.
Probability density function and area under the curve between 0.5 and 0.7. ⥈ ⥈ ⥈Preprocessing for deep learning: from covariance matrix to image whitening
 The left plot shows correlated data. For instance, if you take a data point with a big $x$ value, chances are that $y$ will also be quite big. Now take all data points and do a rotation (maybe around 45 degrees counterclockwise): the new data (plotted on the right) is not correlated anymore.
 ⥈ ⥈ ⥈Deep Learning Book Series · 2.12 Example Principal Components Analysis
 Projection of the data point: the line direction is the one with the largest variance
 ⥈ ⥈ ⥈Deep Learning Book Series · 2.11 The determinant
 The determinant of a matrix can tell you a lot of things about the transformation associated with this matrix
 ⥈ ⥈ ⥈Deep Learning Book Series · 2.10 The Trace Operator
 The trace of matrix
 ⥈ ⥈ ⥈Deep Learning Book Series · 2.9 The Moore Penrose Pseudoinverse
 There is more equations (3) than unknowns (2) so this is an overdetermined system of equations
 ⥈ ⥈ ⥈Deep Learning Book Series · 2.8 Singular Value Decomposition
 The unit circle and its transformation by a matrix
 ⥈ ⥈ ⥈Deep Learning Book Series · 2.7 Eigendecomposition
 The unit circle and its transformation by the matrix A. The vectors are the eigenvectors of A.
 ⥈ ⥈ ⥈Deep Learning Book Series · 2.6 Special Kinds of Matrices and Vectors
 Example of diagonal and symmetric matrices
 ⥈ ⥈ ⥈Deep Learning Book Series · 2.5 Norms
 The squared L2 norm
 ⥈ ⥈ ⥈Deep Learning Book Series · 2.4 Linear Dependence and Span
 A system of equations has no solution, 1 solution or an infinite number of solutions
 ⥈ ⥈ ⥈Deep Learning Book Series · 2.3 Identity and Inverse Matrices
 A 3 by 3 identity matrix
 ⥈ ⥈ ⥈Deep Learning Book Series · 2.2 Multiplying Matrices and Vectors
 The dot product between a matrix and a vector
 ⥈ ⥈ ⥈Deep Learning Book Series · 2.1 Scalars Vectors Matrices and Tensors
 Difference between a scalar, a vector, a matrix and a tensor
 ⥈ ⥈ ⥈Deep Learning Book Series · Introduction
") The Deep Learning Book - Goodfellow, I., Bengio, Y., and Courville, A. (2016)
The Deep Learning Book - Goodfellow, I., Bengio, Y., and Courville, A. (2016) ⥈ ⥈ ⥈